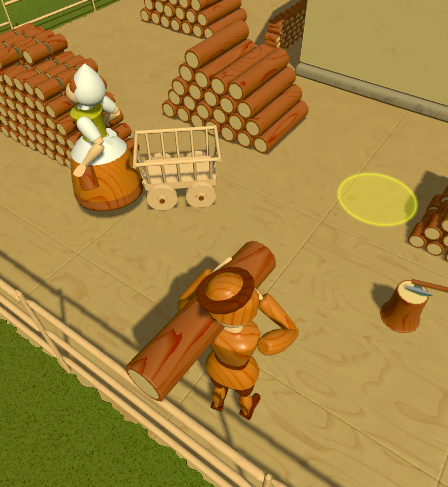
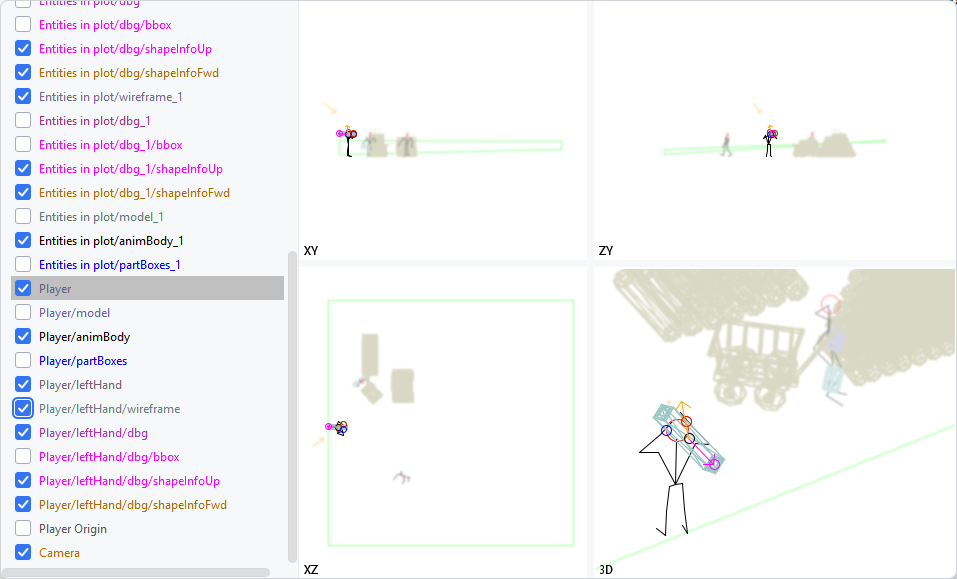
I use a visual debugger for Scala objects in IntelliJ while developing games in Scala. Instead of inspecting runtime values only as strings and field trees, objects can render custom 2D/3D views directly in the debugger.
It was built for geometry-heavy code (meshes, paths, boxes, transforms), but it could also fit graphs, layouts, trees, etc.
It is currently integrated into my closed-source project and requires a custom IntelliJ plugin. The plugin looks for a method similar to toString that returns rich 2D or 3D debug information using a JSON format.
I am considering extracting it into a separate open-source repository if there is enough interest.
Would something like this be useful for your own Scala code? If yes, for which kinds of data structures or domains? Would 2D or 3D be more useful?
5 Likes
A few more technical details and a short video demonstrations is now published at my blog.
3 Likes
Wow, that’s fascinatingly cool. I don’t have much use for 3D in any of my code, but now you’ve got me contemplating the idea of a graph explorer (especially an interactive one) for runtime debugging of the program state, and at first blush that feels like a generally useful tool, likely to provide better glanceability for some situations than typical debug tools.
2 Likes
How could this look to be usable for you? Are you interested in the debugger integration? If you are, what IDE?
I’m unsure, honestly – too many irons in the fire for me to think about this in depth right now. But I’m struck by the idea of being able to define a visualization for a nested data structure, such that I can at-a-glance see its size and scope, to be able to observe it building up as I debug. Intuitively that feels useful, but it would take a bunch of prototyping to validate that idea.
(IntelliJ is my usual IDE.)