I’d like to understand the use model of code profiling my Scala program using IntelliJ. I have found a Profiler menu item in the IntelliJ menus. But as far as I can tell it doesn’t do anything. Do I need to install Jprofiler? Do I need to compile my program with any particular debug flags to make it profilable?
Ideally I’d like to know how much time is being spent on each line or each expression of the Scala program in question. Is that the idea? Or are my expectations completely wrong?
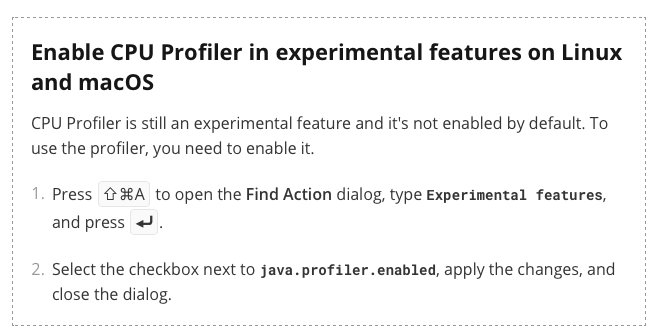
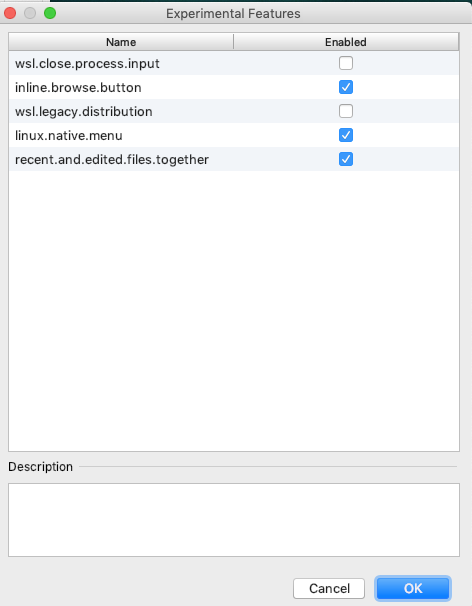
Looks like the profiler is not installed by default because it is experimental on MacOS. Even the instructions on the web page seem to be out of date. It explains that I need to enable java.profile.enabled in the Experimental Features dialog.
But sadly no such feature seems to exist. I’ll inquire with IntelliJ support.
@sangamon, what do I need to do to be able to run the profiler from the command line? One of the links your referred me to suggests the following:
java -agentlib:hprof TheClassName
But I suspect there is more boiler plate necessary:
jimka> java -agentlib:hprof DimacsSuite
Error: Could not find or load main class DimacsSuite
Dumping Java heap ... allocation sites ... done.
jimka> java -agentlib:hprof dimacs.parseDimacs
Error: Could not find or load main class dimacs.parseDimacs
Dumping Java heap ... allocation sites ... done.
jimka>
I can’t say anything regarding the profiler, but as someone at a university you can get IDEA Ultimate for free: Free Educational Licenses - Community Support (includes not only students but also faculty staff)
A few years ago I was doing some JVM profiling and at the time a lot of the sources I found recommended VisualVM. It used to be standard with the JDK download. Looks like it went away after Java 8, but you can still get it at https://visualvm.github.io/. The biggest downside was that it was a GUI that you needed to connect to a process to profile. This is fine for long-running programs like servers, but it doesn’t work for short scripts. On the plus side, the VisualVM seemed to have a much lower performance impact than hprof. My memory is that running my program under hprof made it go something on the order of 10x slower than a normal run but connecting the VisualVM caused less than a 2x performance hit.
A really great option is to use async-profiler as a Java agent (like the hprof example above, but with a much smaller effect on the performance of the application).
You can download it here. Then you pass the path to the profiler shared library when you launch your program:
This will produce an interactive SVG that you can open in your browser. You can also use this approach with the IntelliJ launch configuration or the SBT configuration @sangamon posted.
Note that the error you pasted above is because you have provided no class path to the java process so it does not know where to find the class DimacsSuite. The class name should be fully qualified too (e.g. if it’s in package dimacs, then dimacs.DimacsSuite).
I downloaded the Ultimate edition of IntelliJ and tried again to follow the instructions for the profiler. But there seems to still be a problem. in the mean time I filed an issue at the JetBrains issue tracker. The issue was subsequently triaged without any commentary. Anyone have any idea what that means?