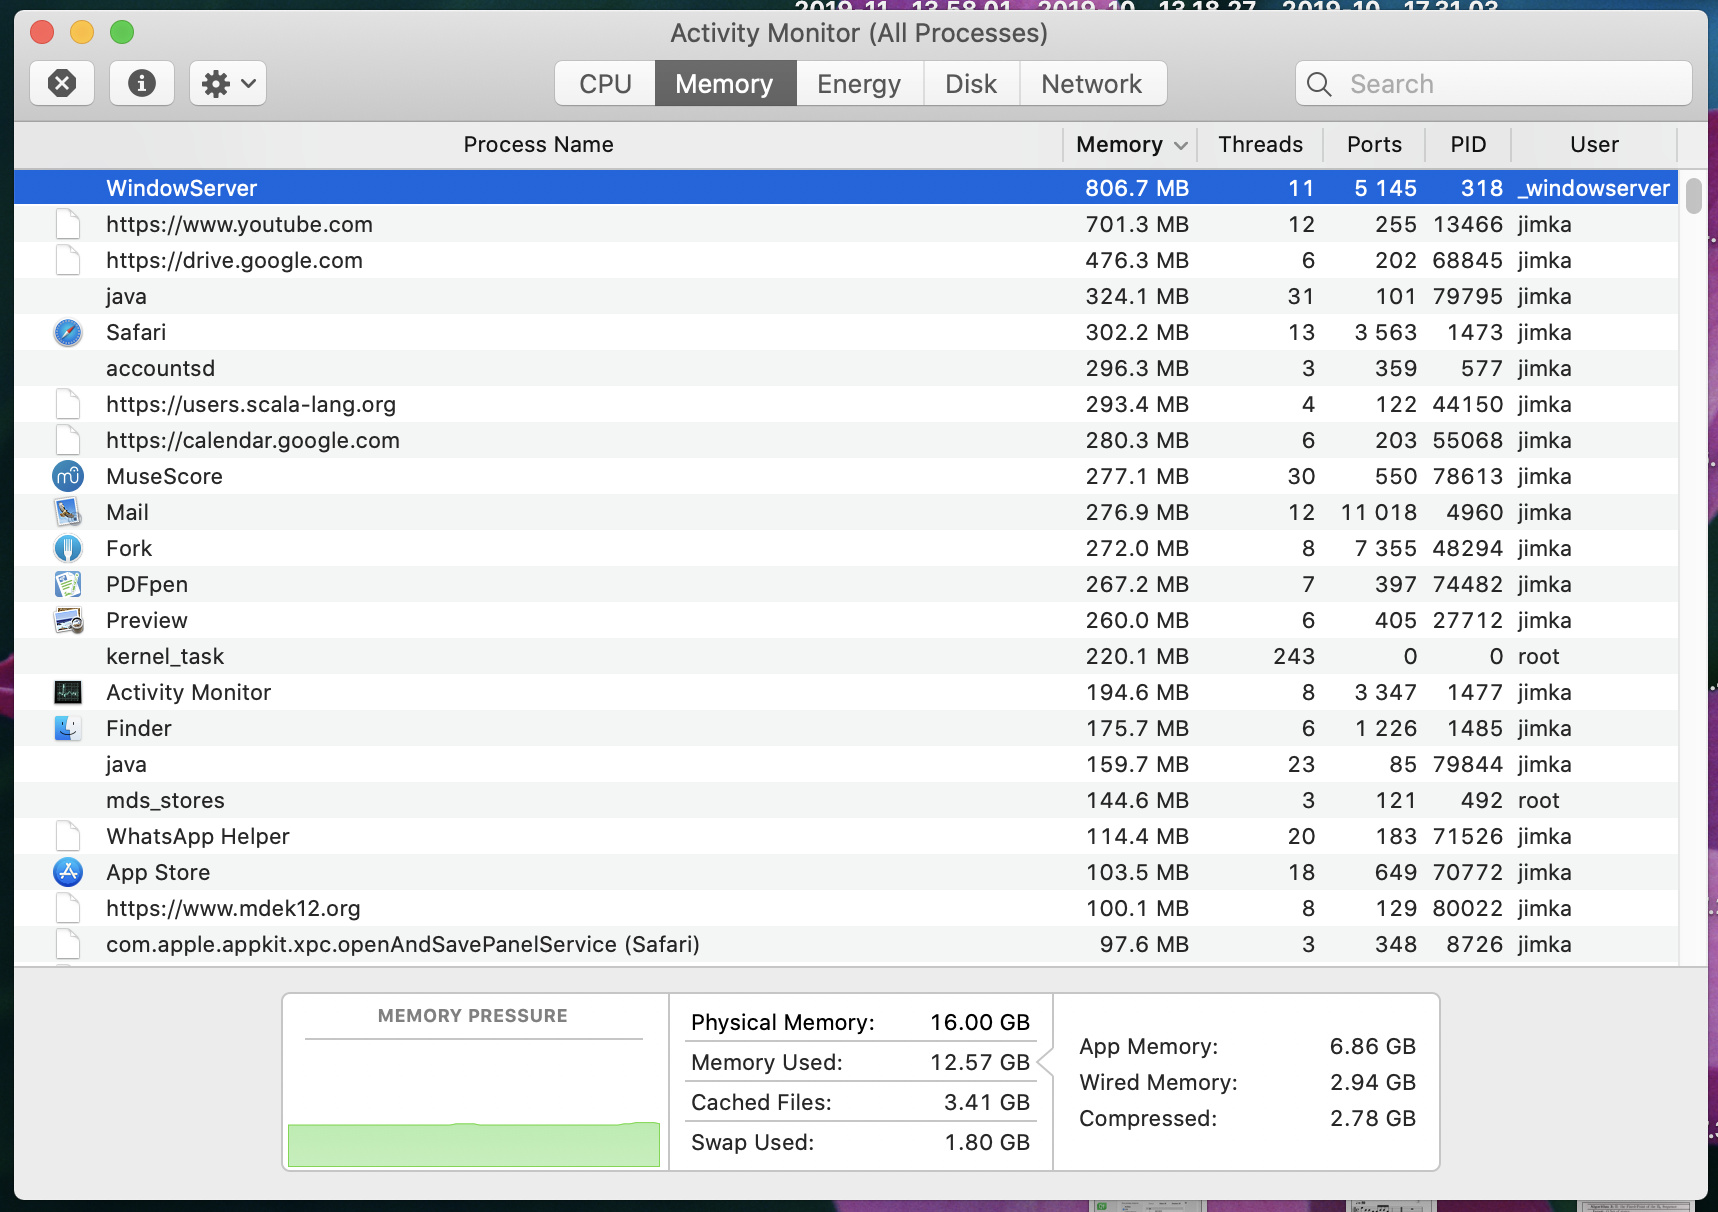
I have a Scala function which allocates a huge number of data structures and stores them in a hash table. Depending on how many variables I have within the class which instantiating I can allocate somewhere between 22 million and 30 million such instances. However, the MacOS activity monitor doesn’t think the memory is being stressed.
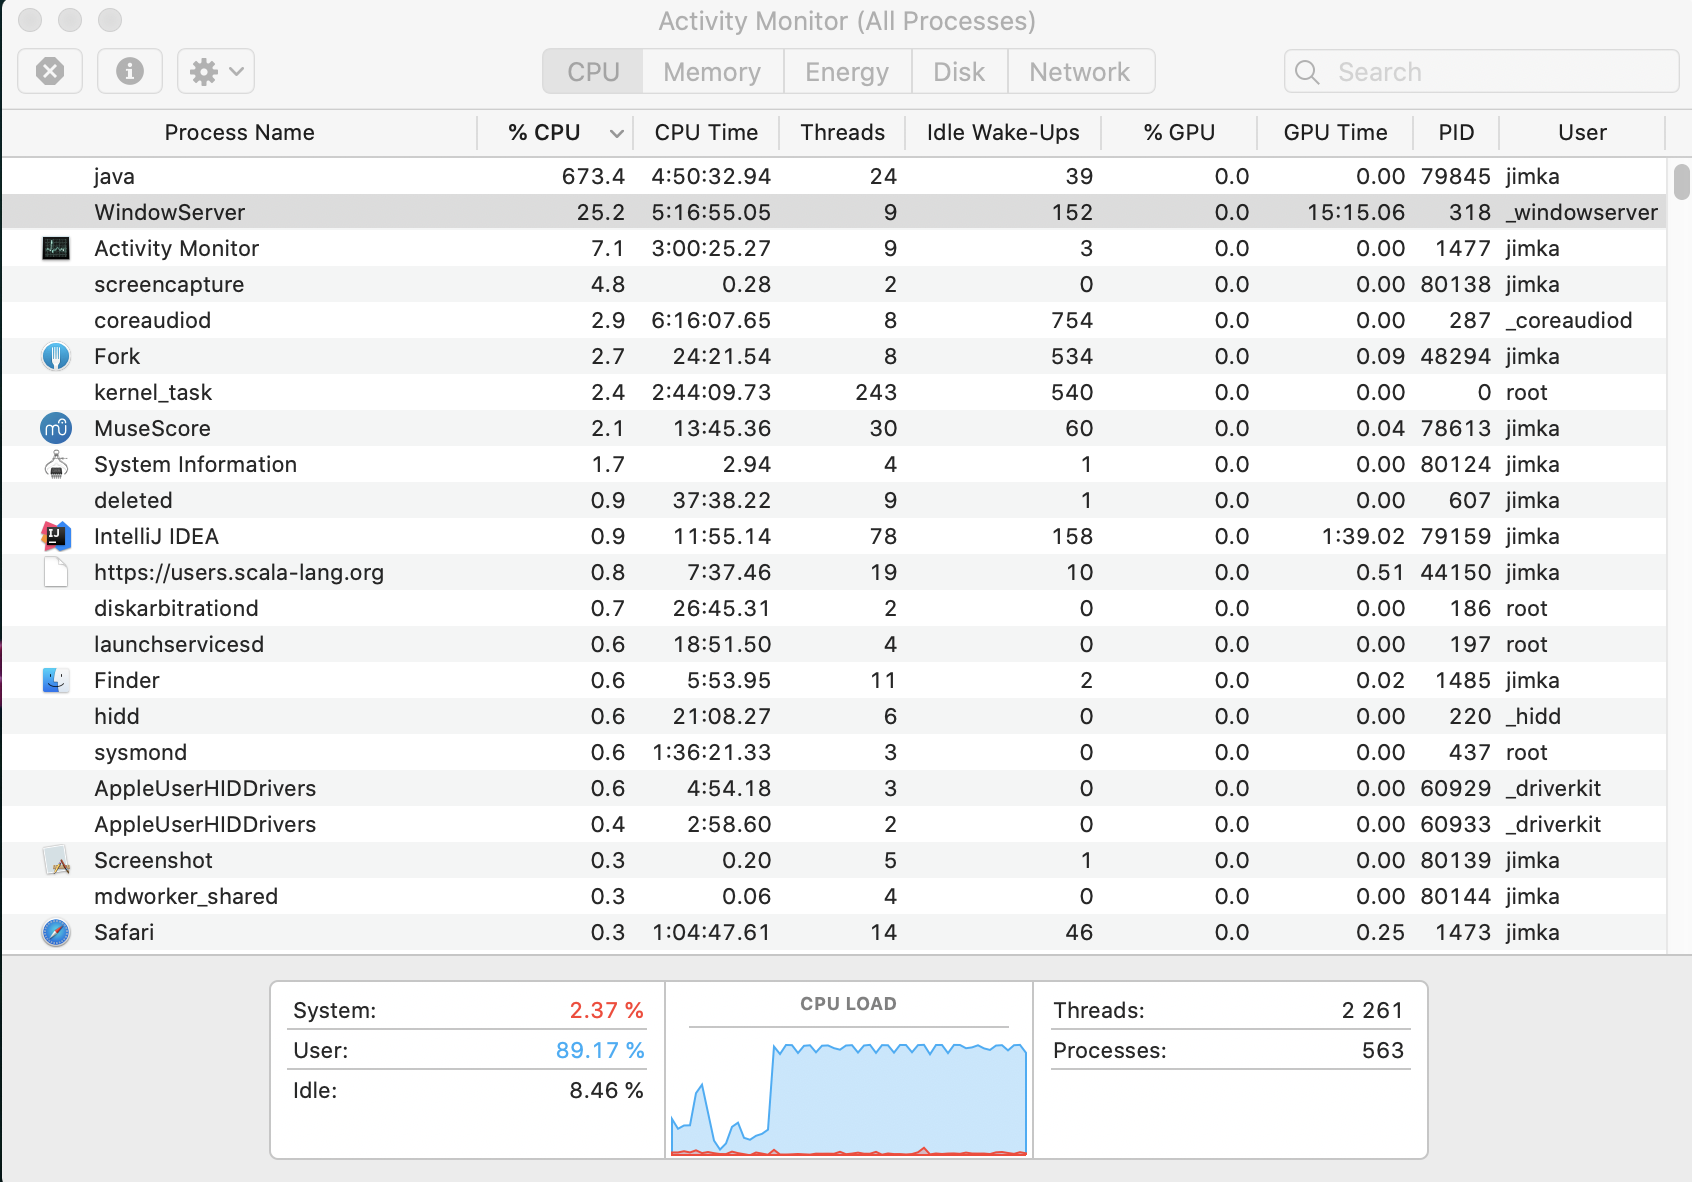
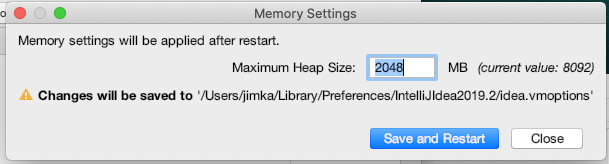
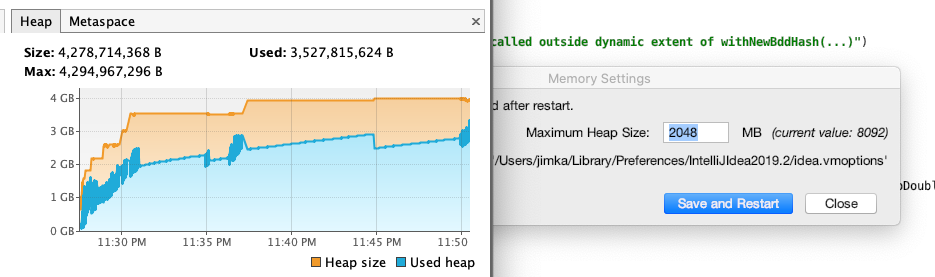
I’ve also doubled the heap size twice in the IntelliJ Memory Settings, from the default 2048 MB to 8092 MB. Without doubling the heap size, I run out of heap while running the program. With this setting at 8092, the program has been running for more than 24 hours, has allocated > 29 million instances (I have a print statement every million allocations)
Is there any relation between the 8GB I’ve requested for the heap size, and the memory meter in the activity monitor?
OS level memory monitor has no insight into internal memory management by JVM. JVM allocates some memory pools (managed heap, unmanaged heap, thread stacks, etc) that have size limit. OoME is usually thrown when GC is unable to free enough memory (i.e. reclaim free memory by collecting garbage) to allow the application to make meaningful progress. For example if a full GC was done and there’s still not enough room to satisfy last failing allocation then OoME will be surely thrown. I’m not really sure what are all the reasons when GC throws OoME, but if you want to track how much time is spent in GC then enable GC logs. Depending on Java version the switches for controlling GC logs output will be different.
If most of the time is spent in GC then probably:
during excessive GC activity most of the heap is composed of live objects
application allocates several small objects of which most quickly become garbage (in GC parlance)
full GC reclaims that little garbage and allows for a little application progress, but that application progress is very small compared to the cost of a single full GC run
If you provide GC logs of your app then situation will probably be clearer.
I suggest turning on VisualVM, which comes with utmost JVM distributions (all?). This shows some insight into heap internals during runtime for JVM-based executables.
How can I know how much memory an instance of a particular class takes up? Am I correct that methods don’t take up any space, because they are store in the class not in the instance?
Right - methods don’t take up any space in a class instance because they’re accessed through class pointer (object.getClass allows to extract that reference from a class instance).
If you want to see precise measurements of objects’ layouts then there’s a tool for that: https://openjdk.java.net/projects/code-tools/jol/ However, you may be interested in cumulative size, e.g. if you have an array of objects then you could be interested in total size of array of references to objects plus size of all objects combined. To do that heap analyzers would be of use, IIRC jvisualvm can do heap dumps and analyze them.
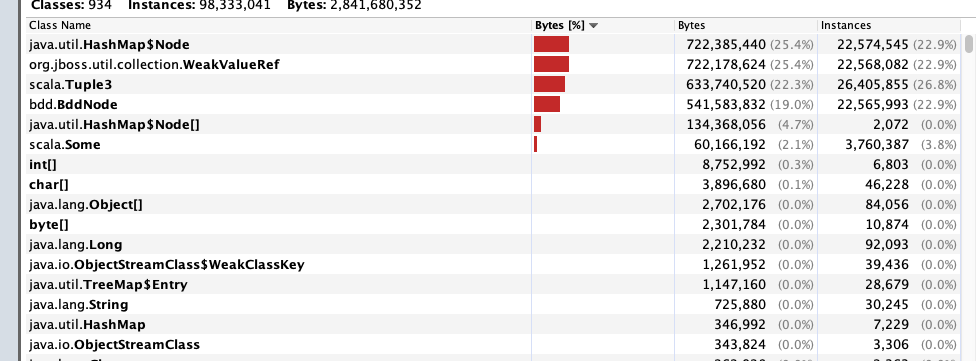
I installed VisualVM. The results are surprising. Looks like hash tables have a huge overhead.
Looks like 22.5 million BddNode instances has total size of 541.6 million bytes.
This means each such node is 24 bytes. And it looks like a HashMap node is 32 bytes. Thats huge. Am I miscalculating something here? And for each HashMap node, there’s a WeakValueRef of the same size? My hash keys are Tuple3’s whose size seems to be 24 bytes?
You only have set the memory for the JVM IntelliJ runs in. Your program will run in a different, freshly spawned JVM. You’ll need to specify memory requirements as an -Xmx VM parameter in the launch configuration.
hmmm, now I’m confused. When I read the following, I interpreted it as meaning that it would set -Xmx in freshly spawned JVMs. Otherwise the IntelliJ configuration option is pretty useless. However, now that I read the link after reading your interpretation I don’t know which it means.
The Java Virtual Machine (JVM) running IntelliJ IDEA allocates some predefined amount of memory.
“The IDE is running low on memory […]”
The IDE is a Java app itself, and depending on project size, plugin usage, etc. it may run into memory issues, likely resulting in sluggish behavior as a first symptom. In which case this option becomes quite useful.