In this line
for ind ← trajList.indices.drop(1) do
are you constructing a new list of indices on every iteration? Will they only be recognised as unreachable until after the loop terminates? I don’t know; only a guess.
you constructing a new list of indices on every iteration?
indices returns a Range which only occupies O(1) storage (the start and end), and drop(1) on Range also returns a Range. so there’s no issue.
:+ is appended, which makes a copy.
So xs = xs.appended(x) will copy the collection before assigning to the reference, so if some internal array (of references to elements of a Vector) is copied, at least that much extra memory is used before it could be collected.
Really? That’s news to me. I had assumed that the original Vector and the new element would somehow be referenced in the new Vector, with no copies made of either.
Are copies made if yield is used to construct the Vector[Encounter]?
This is mostly right. Vector uses structural sharing to greatly reduce copying when appending to a sufficiently long Vector.
Definitely no copying of the elements is taking place. (That’s not how the JVM works; access to objects is always through references.)
Are copies made if yield is used to construct the Vector[Encounter]?
yield is just syntactic sugar for calls to map, flatMap, and withFilter — all of which you can expect to be implemented efficiently — but they do all return new collections, as they logically must.
2 Likes
In Eclipse MAT and JVisualVM (and probably other heap analysis tools, as well), you can trace how an object is reachable. Look for “GC roots” and/or “dominator” in the docs and try this for a couple of your Traj objects (and instances of other suspicious types, like the XML nodes), perhaps.
I am using visualvm. I stopped my run after only 5 conflict checks (of the 720 that would be done in a full run for this case), so the heap space should be nowhere near full. I got a heap dump, but when I do “Computing retained Sizes”, it got to 33% and just stopped. It’s been sitting there for perhaps 30 minutes now with no sign of progress. What is so hard about this computation? I was really hoping for some useful results, but this is frustrating.
1 Like
Try the same thing with jmap instead so you can see where all the objects are. The same problem that causes memory starvation while running also is apparently choking visualvm–probably also running out of memory, or maybe it’s a display issue where they aren’t expecting millions of items. But jmap has much much lower overhead.
The problem might just be that you’re keeping the parsed XML accessible. If you have a ton of XML stuff around, just make sure you call it in a method and return the trajectories, without passing back anything related to XML (so the method takes a path and returns trajectories). Then at least visualvm won’t have to worry about that because it can be GCed.
If you still have problems, winnow things down more. Drop all but two trajectories, with the XML not preserved. Still doesn’t work? Cut the trajectories in half. And so on–visualvm really should work, so you have to cut your problem down until it’s a size that can be inspected manually and you can figure out where the difficulty actually lies.
OK, I did another run of the program that generates the trajectories, and this time I generated only 5 trajectories, which are then dumped into the XML file.
I then ran the program that has the memory leak on those 5 trajectories. I put the reading of the XML file into a separate function that returns the Vector[Traj] as you suggested, so the XML stuff would be garbage collected.
I set the program to stop part way through and ran jmap on it. I tried -heap and -histo options. The -heap option complains about something (I forgot the message) but provides no results, and the -histo option gives me a dump of object counts but no useful information as far as I can tell.
I then opened visualvm 2.2 on it again, and generated a heap dump again. I then opened the profiler for memory on the Traj and Encounter classes. I see about a half dozen lines of results for each, but again I see nothing that shows any information about what is keeping these things from being garbage collected. I see columns labeled “live bytes”, “live objects”, “allocated objects”, and “generations”. What am I missing here, and what do I need to do to figure out which objects are holding references to these objects and keeping them from being garbage collected?
One more thing. It seems that there should be some function I should be able to call from my own source code, perhaps using reflection, that provides the information I am looking for, namely the objects that are holding references preventing garbage collection. Does anything like that exist in the Scala or java libraries? If not, why not?
As suggested above, look for “paths to GC roots” or similar. In MAT:
- Open “Histogram” (or other view) and enter a class name (e.g.
Traj) in the <Regex> field below the “Class Name” column header. - Select the class under investigation in the filtered table output, choose “List objects… with incoming references” in the (right click) context menu.
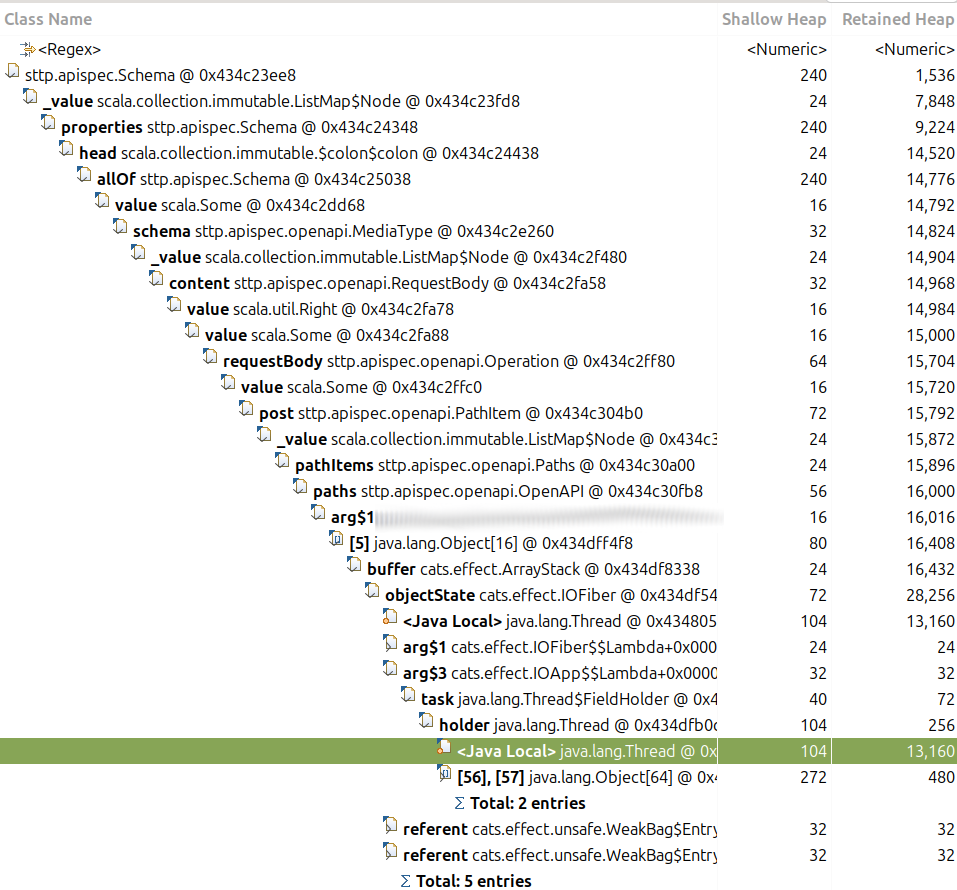
- Select an (arbitrary) instance from the resulting list, choose “Path to GC Roots… with all references”.
- You’ll end up with a tree view of all paths that lead from the instance to the GC roots.
- Rinse and repeat with other instances of this type and/or other types under suspicion.
Example output for an sttp.apispec.Schema instance:
Given that after 30 years of the JVM all these tools feel somewhat inconvenient, there surely is some essential complexity involved. My naive guess is that it’s complex (and still slow) to do for bigger dump sizes without running into out of memory conditions. ![]() The best defense is to code in ways that avoid memory leaks in the first place, and/or to code in ways that allow running on small problem sizes. Which is much easier said than done, I know…
The best defense is to code in ways that avoid memory leaks in the first place, and/or to code in ways that allow running on small problem sizes. Which is much easier said than done, I know…
1 Like
Likely unrelated to the actual problem, but I ran into stack overflows (from compiling though) recently and solved it by setting -xss2M - lowering from a previous higher value. You might try this just for fun to see if it affects your problem. I tested various xss values and found the lowest compile time duration with -xss2M causing no stack overflows anymore.
1 Like
I still have not yet solved this memory leak. Can someone tell me how to force garbage collection on an object? I know how to tell the garbage collector to run (by calling System.gc()), but I want to force a particular object to be collected. Is that possible? I googled it, but I did not see much. I realize it is risky and not good practice in general, but at this point I am desperate. If it causes a problem somewhere else, that will at least provide a clue about the extraneous reference that is preventing it from being collected.
Here is the relevant code snippet again:
I want to force garbage collection on the value enc after the line
if enc.isaConflict then conflicts :+= enc
How can I do that?
So, first of all, you absolutely definitely positively cannot deallocate objects that are being managed by the GC (which is everything, unless you use esoteric off-heap memory).
You need to use other methods to indirectly get at these things. If you have an object that could be collected, and it’s taking a lot of memory, the GC will deallocate it pretty eagerly, generally, especially if you suggest that the GC runs. But you can’t be absolutely sure; there’s a ton of tuning to make sure that the GC is well-behaved, and there are limits on how unruly you can ask it to be.
That said, you should try the following.
Outside the for loop, get your hands on an instance of the memory pool objects and create a helper method to print them out:
val pools = java.lang.management.ManagementFactory.getMemoryPoolMXBeans
def report(title: String): Unit =
  println(title)
  pools.forEach{ pool =>
    val usage = pool.getUsage
    println(s"Pool ${pool.getName} is using ${usage.getUsed} of ${usage.getMax} bytes")
  }
  println()
Then, at the beginning of your while loop,
report("Before clear")
Runtime.getRuntime.gc()
report("After clear")
(Note that Runtime.getRuntime.gc() is a suggestion–one that is usually followed, but it’s free to ignore the suggestion if it thinks it knows better than you do. But you will see the usage of some pools go down if, in fact, it did decide to do something and there was anything to do. It might make some pools go up e.g. if it moves from young generation to old generation. Once you know which pools your GC is using–it depends on the one that is being used by your runtime–you might want to sum old and new generation and get an extra output for that.)
You might want a report("Before while") and report("After while"), and also before/after the for.
This will show you how the memory usage changes as you go through item by item in the loops. If you get a steady increase, you’re hanging on to memory. If it goes up and down, you at the very least might not be hanging on to everything.
Another trick that you can use to tell if a variable has been GCed is to get a WeakReference to it. In this case, you can test whether your enc objects themselves have been collected. This doesn’t guarantee their contents have–maybe something else is pointing at the contents–but you at least know that you need to go into the internals and see what is grabbing what.
To do this, you would do something like this. Outside the for loop,
var refs: List[(Int, Int, java.lang.ref.WeakReference[Encounter])] = Nil
def checkIsThere(item: (Int, Int, java.lang.ref.WeakReference[Encounter])): Boolean =
  if item._3.get() eq null then
    println(s"${item._1} vs ${item._2} cleared")
    false
  else
    println(s"${item._1} vs ${item._2} is still there")
    true
def checks(): Unit =
  refs = refs.filter(checkIsThere)
Now you have a way to monitor when things seem like they will be or have been cleared, because WeakReference flips to null when an object becomes elegible for garbage collection, and doesn’t impact eligibility itself. You use it by, after creating your encounter in the while loop, doing
refs = ((ind1, ind2, enc)) :: refs
and then at some point (first or last statement inside the while loop, maybe) calling checks().
This should give you a variety of ways to monitor the total memory used and the probable GC status of individual objects.
2 Likes
Were you able to follow sangamon’s advice? It seems like very sound advice to me — if you think an object should be eligible for GC but it isn’t, viewing that object’s path to its GC root will tell you exactly why it’s ineligible.
Maybe you need to give visualvm itself more heap…?
Sorry if this is a dumb question, but what is “MAT”?
I did the first part of what you suggested, and I found that Pool G1 Old Gen is huge. Nothing else seems to be of the same order of magnitude. Does that indicate anything significant?
press to continue
340 processed, 0 conflicts found
Before gc:
Pool CodeHeap ‘non-nmethods’ is using 1609728 of 8196096 bytes
Pool Metaspace is using 15780936 of -1 bytes
Pool CodeHeap ‘profiled nmethods’ is using 5050496 of 121729024 bytes
Pool Compressed Class Space is using 1590792 of 1073741824 bytes
Pool G1 Eden Space is using 37748736 of -1 bytes
Pool G1 Old Gen is using 8186601720 of 8329887744 bytes
Pool G1 Survivor Space is using 0 of -1 bytes
Pool CodeHeap ‘non-profiled nmethods’ is using 4386816 of 121733120 bytes
After gc:
Pool CodeHeap ‘non-nmethods’ is using 1609728 of 8196096 bytes
Pool Metaspace is using 15780936 of -1 bytes
Pool CodeHeap ‘profiled nmethods’ is using 5050496 of 121729024 bytes
Pool Compressed Class Space is using 1590792 of 1073741824 bytes
Pool G1 Eden Space is using 0 of -1 bytes
Pool G1 Old Gen is using 8155754072 of 8329887744 bytes
Pool G1 Survivor Space is using 0 of -1 bytes
Pool CodeHeap ‘non-profiled nmethods’ is using 4386816 of 121733120 bytes
press to continue
345 processed, 0 conflicts found
Before gc:
Pool CodeHeap ‘non-nmethods’ is using 1609728 of 8196096 bytes
Pool Metaspace is using 15780936 of -1 bytes
Pool CodeHeap ‘profiled nmethods’ is using 5048064 of 121729024 bytes
Pool Compressed Class Space is using 1590792 of 1073741824 bytes
Pool G1 Eden Space is using 50331648 of -1 bytes
Pool G1 Old Gen is using 8238076232 of 8329887744 bytes
Pool G1 Survivor Space is using 0 of -1 bytes
Pool CodeHeap ‘non-profiled nmethods’ is using 4387712 of 121733120 bytes
After gc:
Pool CodeHeap ‘non-nmethods’ is using 1609728 of 8196096 bytes
Pool Metaspace is using 15780936 of -1 bytes
Pool CodeHeap ‘profiled nmethods’ is using 5048064 of 121729024 bytes
Pool Compressed Class Space is using 1590792 of 1073741824 bytes
Pool G1 Eden Space is using 0 of -1 bytes
Pool G1 Old Gen is using 8238071960 of 8329887744 bytes
Pool G1 Survivor Space is using 0 of -1 bytes
Pool CodeHeap ‘non-profiled nmethods’ is using 4387712 of 121733120 bytes
Old Gen is where long lived objects are placed by the GC, so really it indicates what you already know, some objects are being held onto.
There will be a process that tries to remove objects from old Gen, but if there are still references to those objects it will continue to grow.
You could try to walk through that isaConflict function and identify what memory is being allocated. If you use intellij you can pretty easily execute a program with a profiler and it will give you a memory allocation information as well.
Eclipse Memory Analyzer. jvisualvm almost certainly has similar features, but I’m even less familiar with it than I am with MAT.
Why does this say 340 or 345 processed? I thought you had only 5 trajectories at this point. I guess you decided on a larger run?
Anyway, you went up from 8156MB to 8238MB in one iteration, so you’re picking up ~80MB in old gen per five iterations. If it’s roughly linear, 340 iterations would pick up ~6GB, which is roughly consistent with the total usage.
So, you’re almost certainly holding on to extra memory with every iteration.
Now you need to figure out if it is the Encounter object itself that is being held onto somewhere or something else. For this, use the WeakReference trick and see what it says.
The logic is going to be the same regardless of how many iterations, so you should cut it back to 5-10 and browse it in VisualVM, really. But this will also slowly get you towards finding what the problem is.
I did a run with only 5 trajectories so I could analyze it with visualvm without having to wait forever, but I have yet to get any useful information from that.
However, I also kept the data for the larger run with 720 trajectories. I go back to that case for testing new ideas to see if it starts to bog down at around index 340 – and it always does.
Here’s something I don’t understand. The program that is bogging down and running out heap space is a fairly simple script that reads trajectories from an XML file and checks them for conflicts. It is actually a verification of correctness for another more complex program (a fast-time simulation) that generates the trajectories, which are supposed to be free of conflicts.
But here is what I don’t understand. The fast-time simulation ultimately does the same check for conflicts (using the Encounter class) that the simpler script does, but it does not seem to have a problem with heap space. How can that be? I don’t understand how the verfication script can have a memory leak when the fast-time simulation program apparently doesn’t.
(By the way, I can’t get back to debugging this memory leak for a few days at least.)